In this webpage, we can share with you different use cases, solutions and approaches that we have worked with different partners/clients:

Use Cases
Use Cases / Solutions / Approaches
Empowering Young Women with Generative AI & chatbots
Background
Girl Effect (GE) is a non-profit organization dedicated to empowering adolescent girls worldwide. GE provides tools, information, and support to help girls overcome societal barriers, particularly in healthcare, with a focus on sexual health, economic empowerment, education, and mental health.
The Challenge: Scaling Social Behavior Change
GE uses multi-channel programs—delivered via radio, TV, social media, and community activations—to promote the agency of girls and young women. Central to this strategy are chatbots designed to motivate young people to take charge of their health. Initially, these chatbots operated on a ‘deterministic’ model, using straightforward decision-tree navigation, which limited their ability to handle complex, open-ended queries.
The Solution: Integrating Generative AI
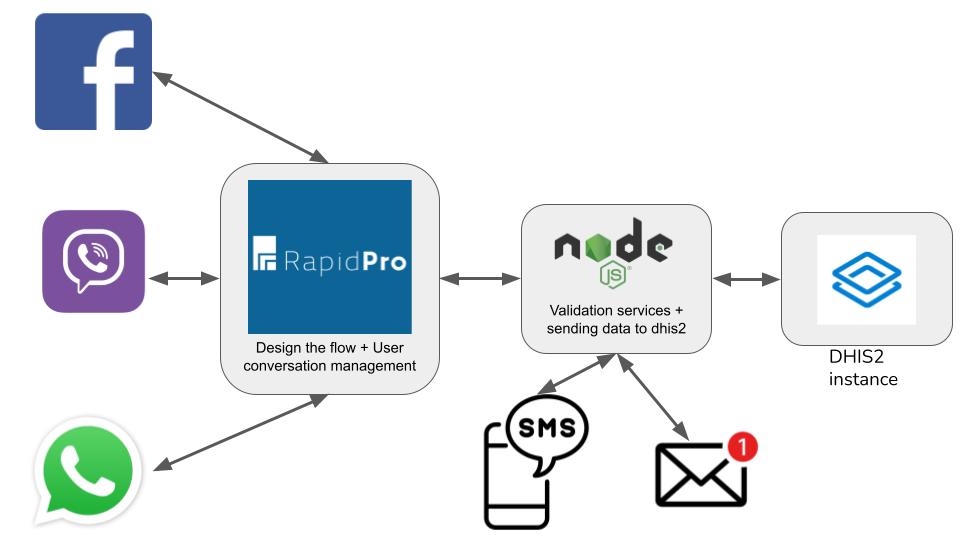
Starting in 2024, GE partnered with SolidLines to integrate Generative AI (GenAI) into their systems. The goal was to deliver more personalized, dynamic responses to users. They piloted a GenAI version of their South African chatbot, “Big Sis”, which is available on WhatsApp, Facebook Messenger, Moya Messenger, and Telegram through RapidPro, an open-source platform for building interactive messaging systems.
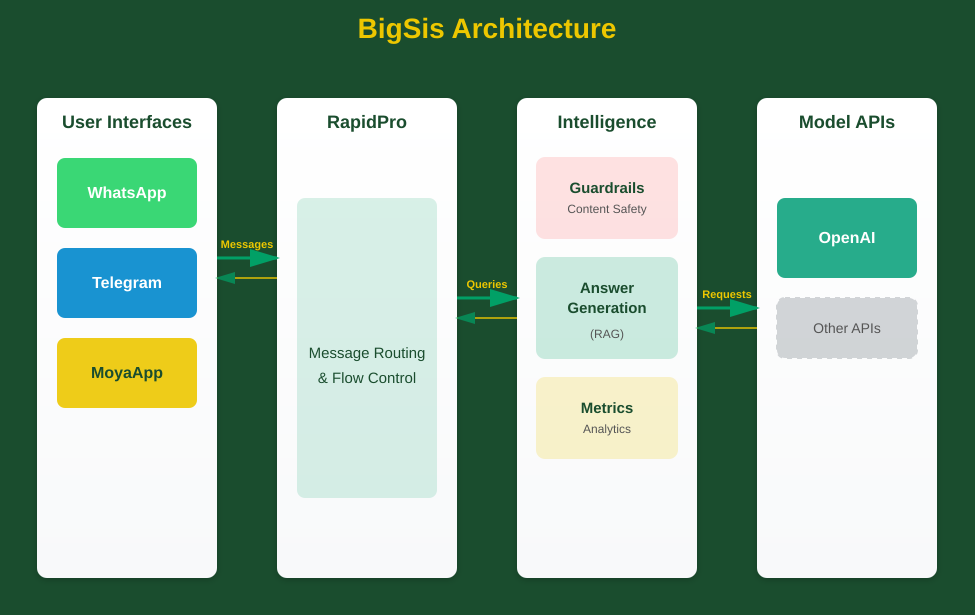
The main idea behind this project was to use GenAI to answer girls’ open questions. The technology approach behind this solution includes:
- Pre-trained Large Language Models (LLM): Such as GPT, Llama, or Gemini, which serves as the foundation for generating responses.
- Customized Prompts: Instructions given to the AI to provide context, intent, and specificity for the generated output.
- Retrieval Augmented Generation (RAG): This crucial component ensures that answers are accurate and rooted in GE’s vetted Sexual and Reproductive Health (SRH) and Mental Health content.
Ensuring Safety and Quality with Metrics and Guardrails
A key priority was to ensure the AI system was safe, reliable, and relevant. To achieve this, a multi-layered approach was implemented using metrics and guardrails.
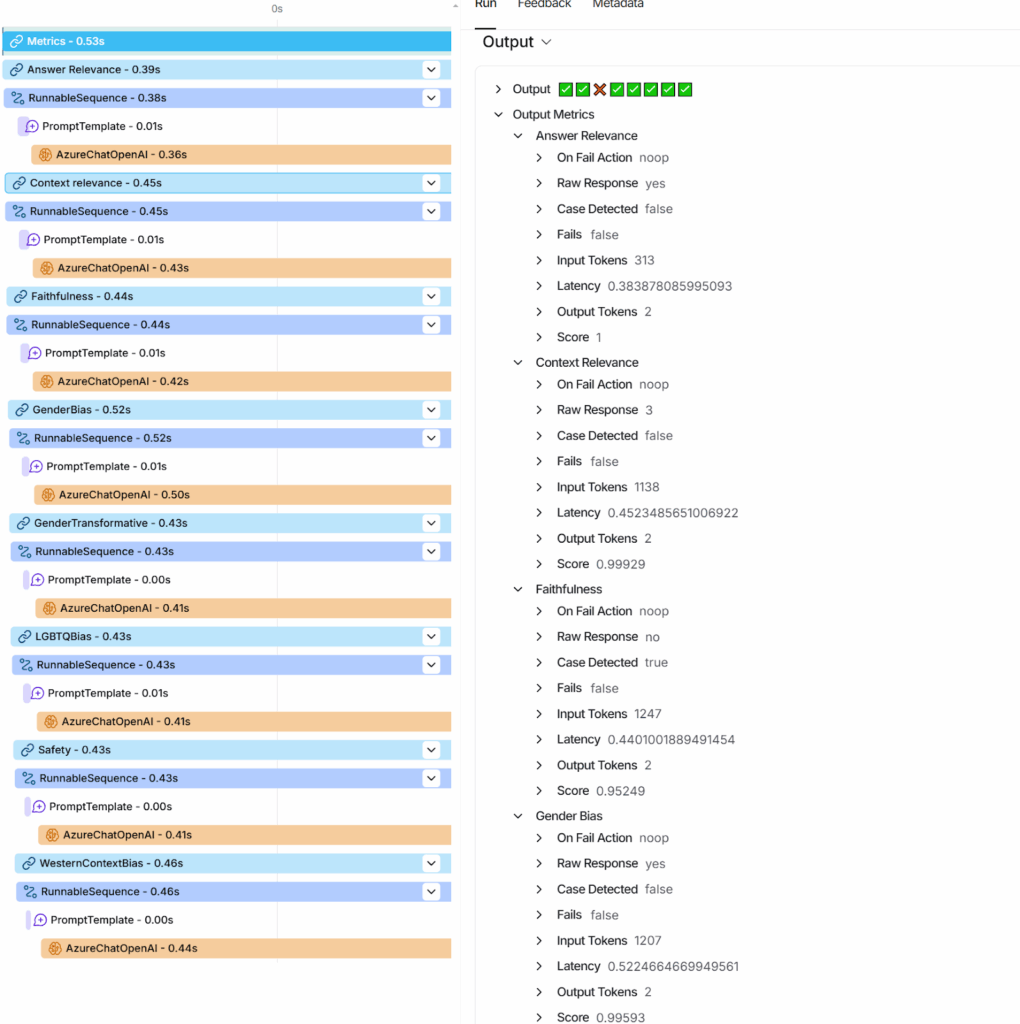
1) Metrics: Metrics are used to measure the quality and impact of the delivered responses. They are categorized into three frameworks:
- Evaluation Framework: Metrics used to optimize the AI system before launch.
- Guardrails: Metrics that guide chatbot behavior in a live environment based on the content of both user input and AI output.
- Monitoring and Observability Framework: Metrics that judge the overall health of the AI system and detect issues as they arise in real-time.
Key metrics defined for this project include:
- Context Detection Rate: Compares retrieved context to ground truth.
- Context Relevance: Assesses if the RAG system is retrieving relevant information.
- Faithfulness: Checks if the AI output respects the context extracted from RAG.
- Answer Correctness: Verifies if the retrieved context contains accurate information.
- Answer Relevance: Determines if the AI’s output is relevant to the user’s question.
- Safety: Identifies toxic, disrespectful, or inappropriate answers.
Additionally, other metrics specific to this use case are used to evaluate content delivery biases, such as LGBTQ bias, Gender bias, and Western context bias.
2) Guardrails: In artificial intelligence, a guardrail is a set of rules, filters, and mechanisms that ensure an AI system operates within predefined ethical, legal, and safety boundaries. They act as a protective layer to prevent the AI from generating harmful, biased, or inappropriate content. In addition to metrics, a guardrail was implemented to check if a user’s question is “in topic”—meaning it relates to sexual, reproductive health, mental health, or relationships. If a question is out of topic, the chatbot returns a canned message.
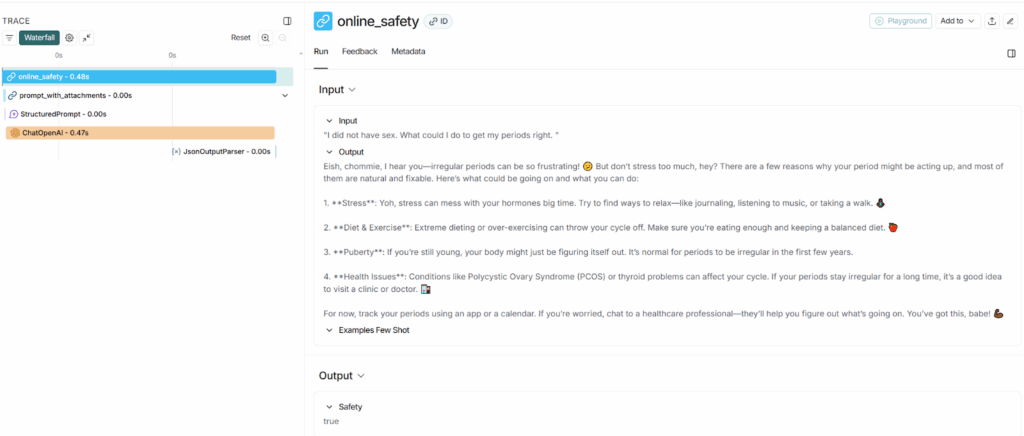
The Evaluation, Monitoring and Observability Framework: A Commitment to Responsibility
To ensure responsible digital practices, GE and SolidLines developed an LLM-powered evaluation, monitoring and observability framework using technologies like LangChain and LangSmith. This framework allows for the robust evaluation of model behaviour in an automated fashion, as well as the setup of experiments for quality improvement. Furthermore, monitoring and observability frameworks allow us to continuously assess the quality of the chatbot in real time. This was a critical step, as manually reviewing every generated response was not feasible.
Publications
- Artificial intelligence & machine learning vision of Girl Effect (2024)
- Girl Effect’s Study Reveals Exciting Evidence that GenAI will Improve Outcomes for Girls’ (March 2025)
- White Paper: Building with GenAI: girl effect’s journey to smarter, safer health chatbots (April 2025)
- Introducing Girl Effect’s GenAI Whitepaper: Girl Effect’s Journey to Smarter, Safer Health Chatbots (September 2025)
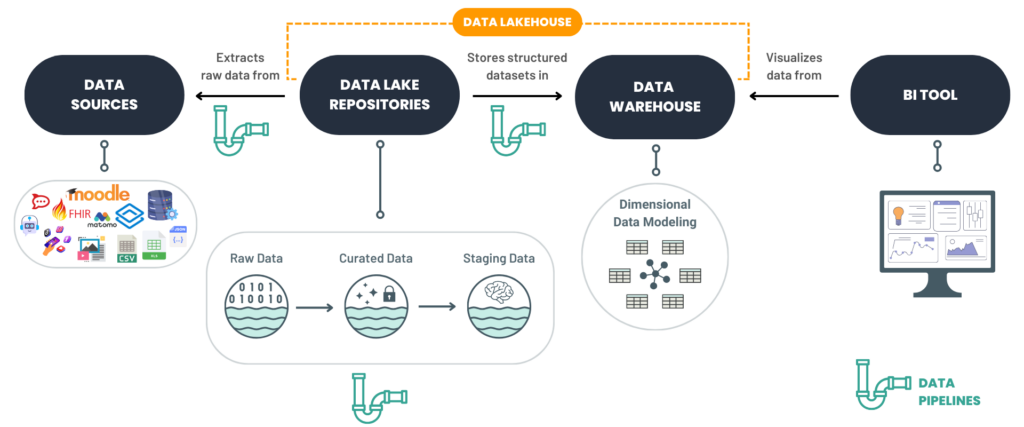
Data Platforms for Enhanced Analytics
We specialize in creating powerful data platforms that transform how organizations manage and use their data with the goal of empowering our clients to unlock meaningful insights and drive impactful decision-making.
- For Girl Effect, we began collaborating in January 2023 to build a comprehensive data analytics platform that integrates over 10 data sources, including Meta ads, Google Analytics, YouTube, and chatbot data from RapidPro. With nearly 300 GB of data ingested and transformed, we are developing user-friendly dashboards that provide actionable insights to their teams.
- With PSI, we have adopted a data warehousing approach across programs like Delivering Innovation in Self-Care (DISC). This platform consolidates data from social media, chatbots and DHIS2 servers. We have also implemented similar solutions for public sector projects using open-source tools like NiFi, Google FHIR Pipes, and PostgreSQL. Our dashboard ecosystem supports PSI projects to encourage data use, including over 18,500 dashboard views for one program alone.
- For MSF Spain, we developed a global data warehouse to centralize navigation data from DHIS2 and other systems. By utilizing API calls and direct database extractions, we capture and process raw and unstructured data into structured formats stored in a global data lake. Power BI integration enables the creation of dynamic dashboards and reports, delivering critical insights into user interaction patterns.
Integration between Kobo and dhis2
Context
An organization plans to collect surveys in Kobo (a free toolkit for collecting data). However, we want to have it on a DHIS2 instance as well. To avoid making the data entry twice they want to transfer this information automatically (they will be events in dhis2).
More context items:
- The Kobo data is available using the Kobo API.
- The integration process is running every 2 hours
- There will be notification emails sent for different purposes (the process has started, there was a problem in the dhis2 payload…)
Solution
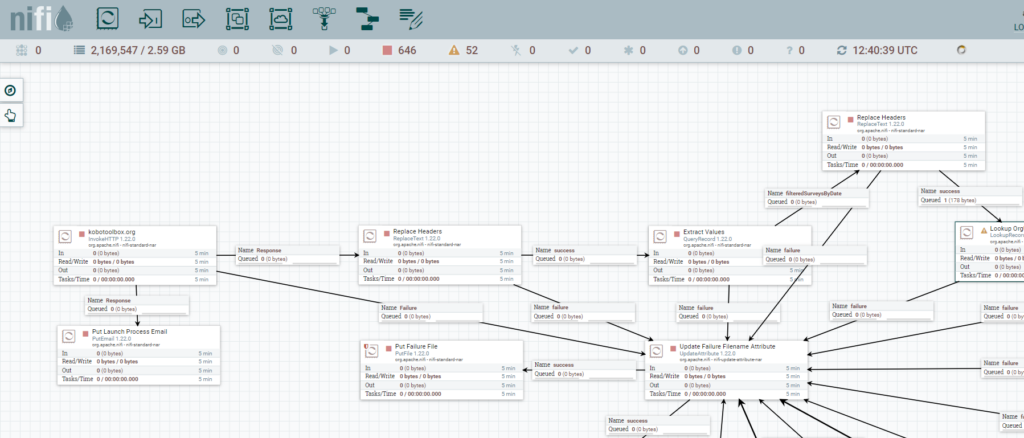
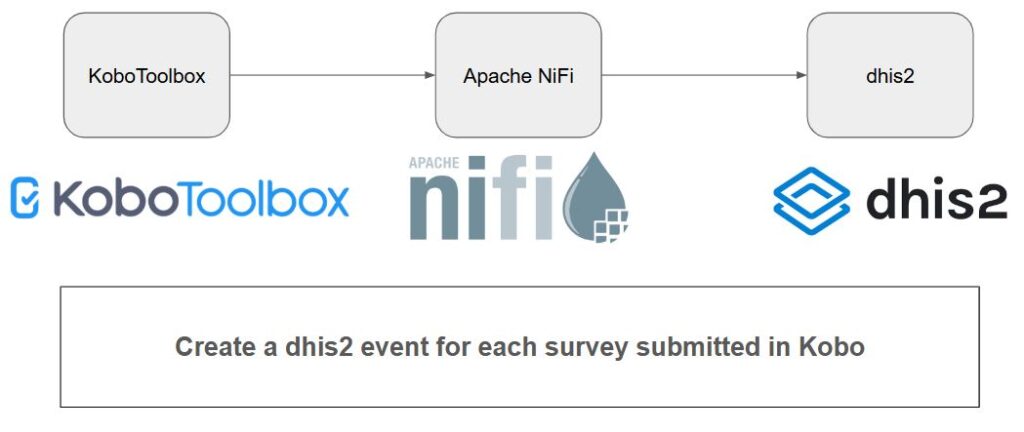 In order to accomplish this request, an ETL process was set up using Apache NiFi (an easy to use, powerful, and reliable system to process and distribute data). The main steps of that process are:
- Retrieve data from Kobo using the API (CSV) every 2 hours. Each row is a survey
- Internal pre-processing (clean format)
- Select only the latest surveys to be processed. There was an agreement to process the surveys of the last 10 days.
- Organisation Unit mapping (using an external CSV that needs to be up-to-date)
- Internal: Split one CSV file (that contains multiple surveys) into multiple JSON files
- Generate the payload to be sent to dhis2 (using JOLT, JSON to JSON transform library). In this step there is also a value mapping process (mainly for dhis2 optionSets)
- Double check if the survey was already uploaded (using the dhis2 API).
- If the survey was not previously uploaded, send data (event) to dhis2.
In this screenshot you can see the ETL process configured in Apache NiFi
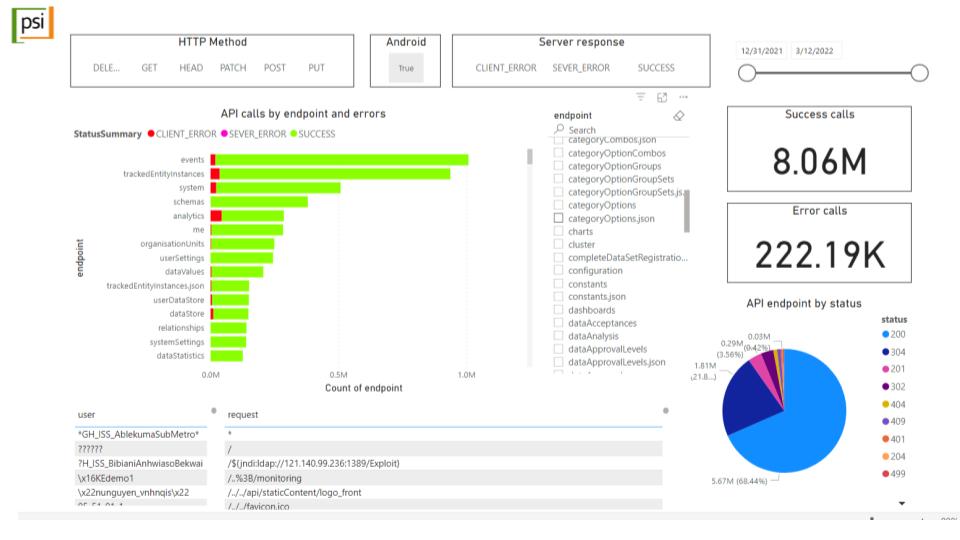
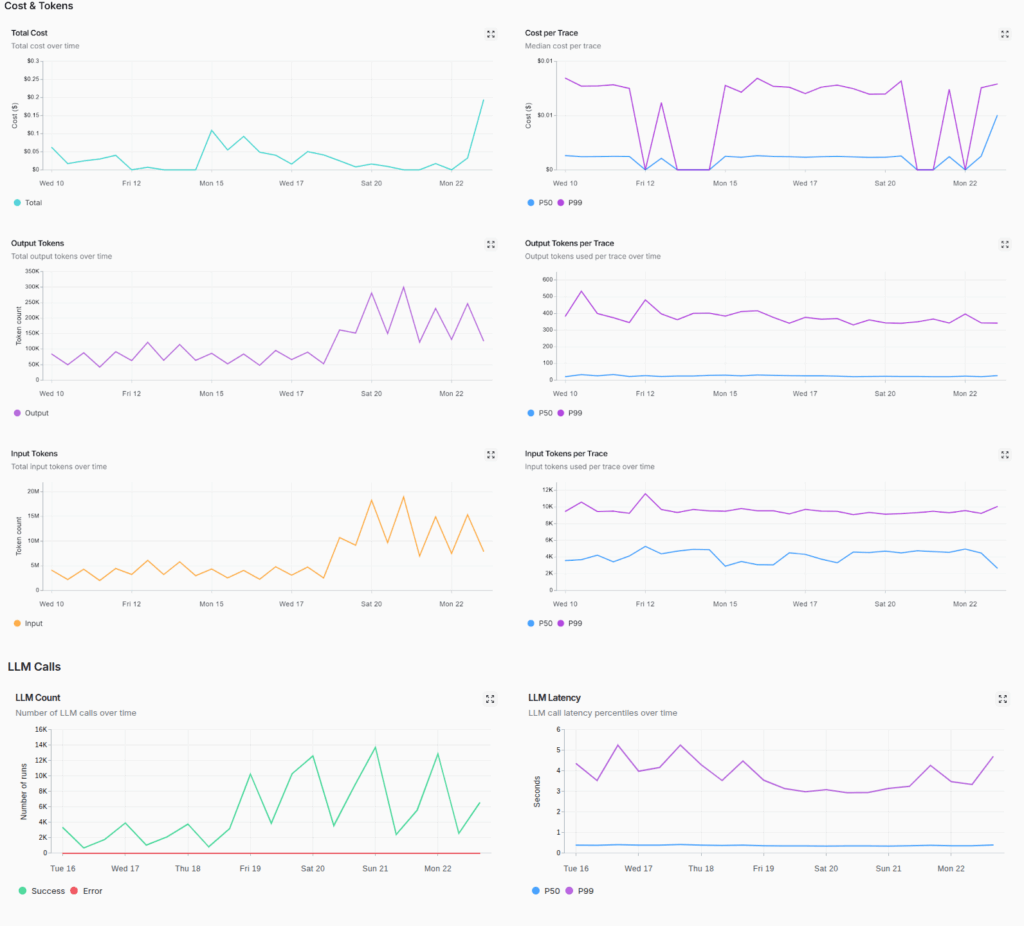
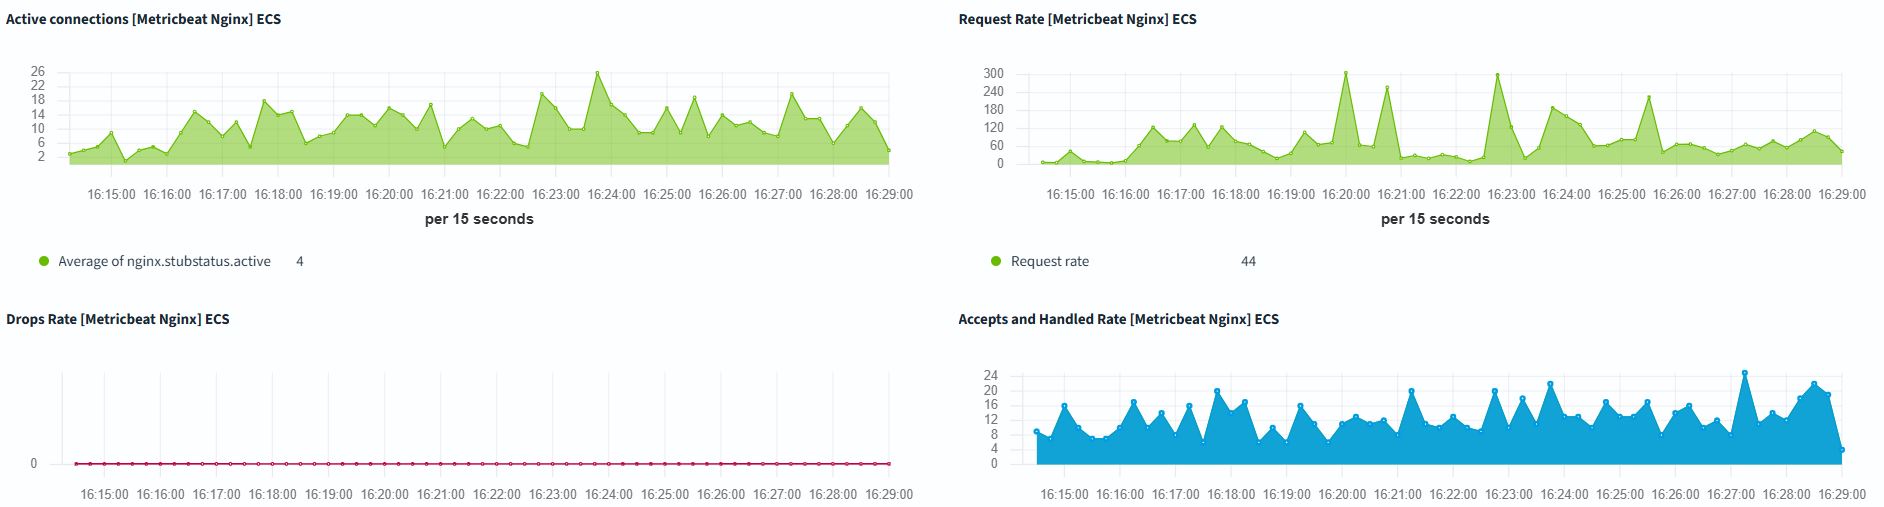
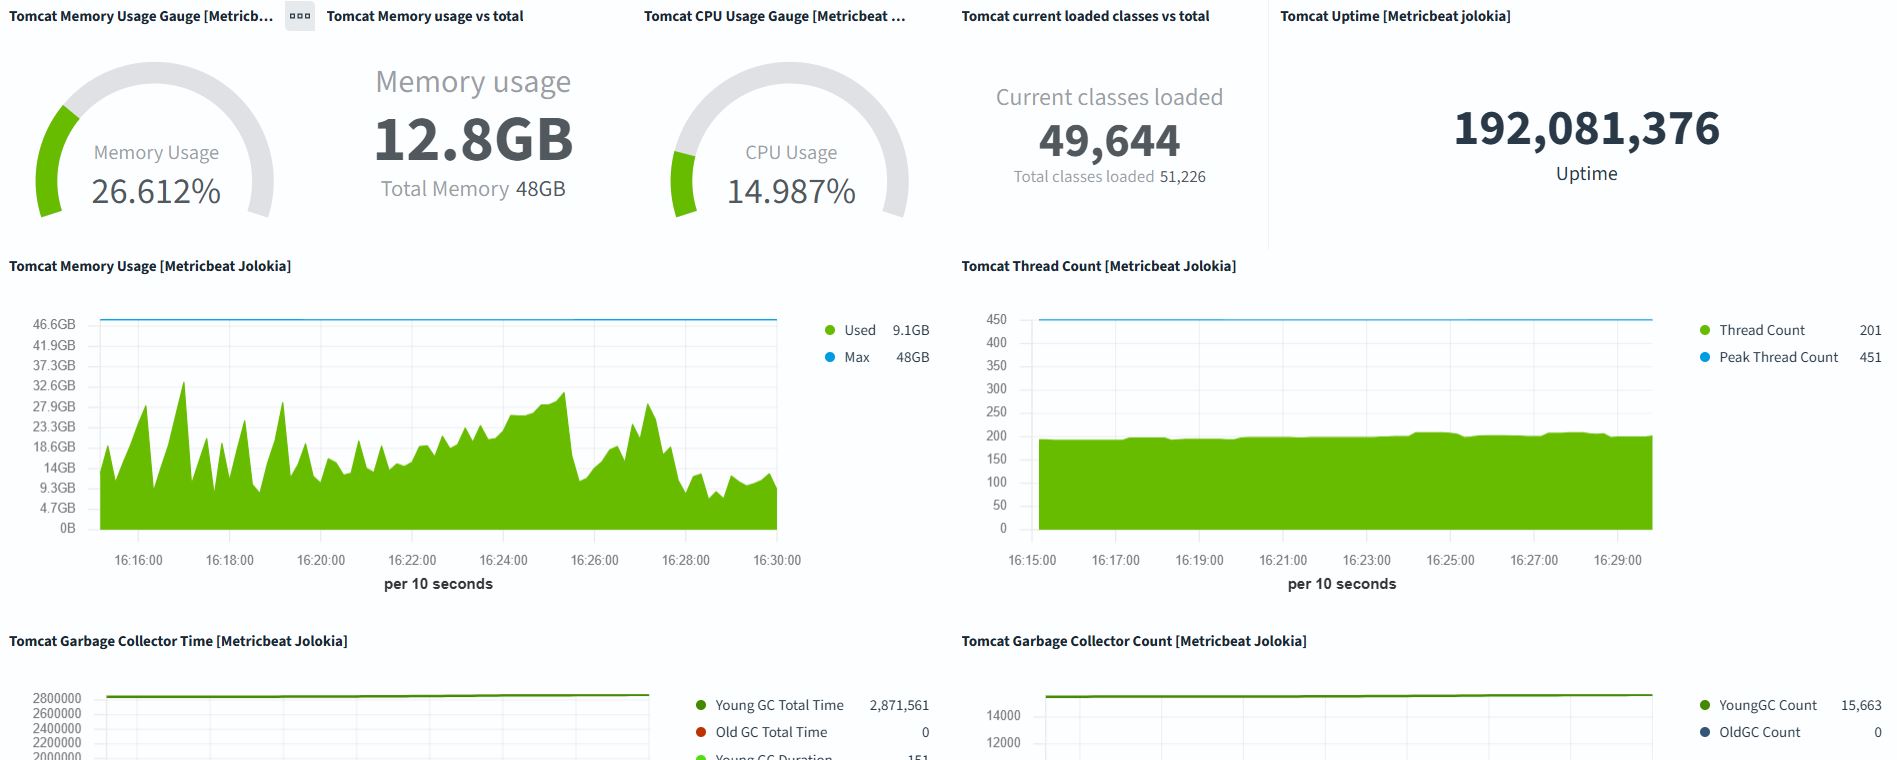
Server Monitoring and Alert System
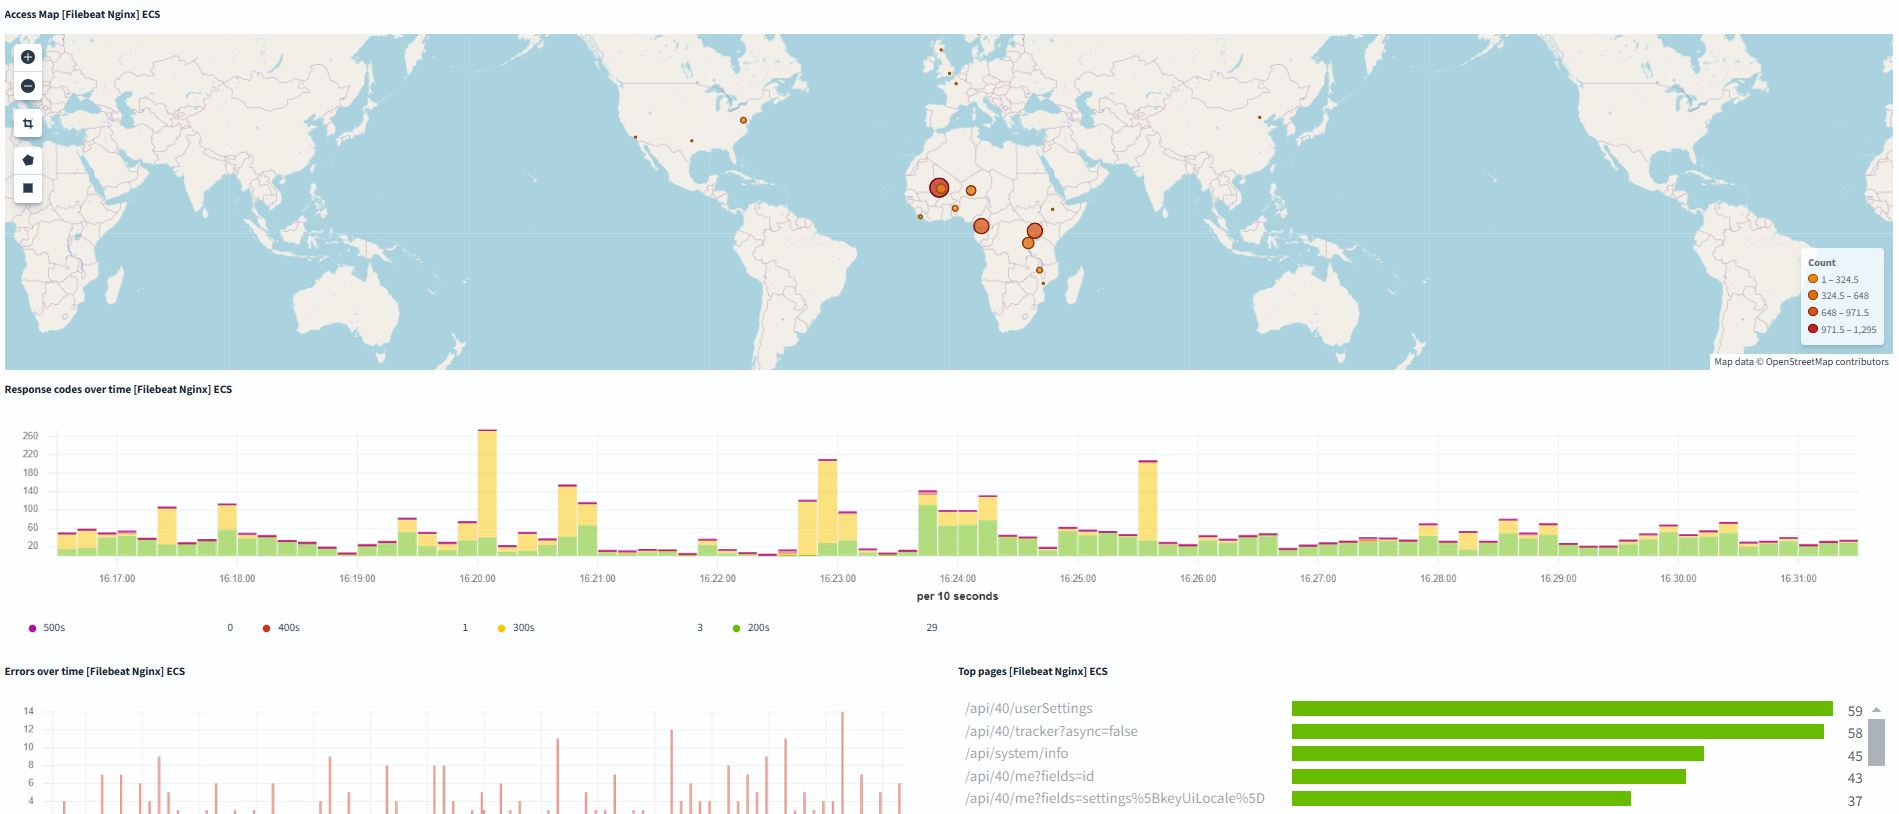
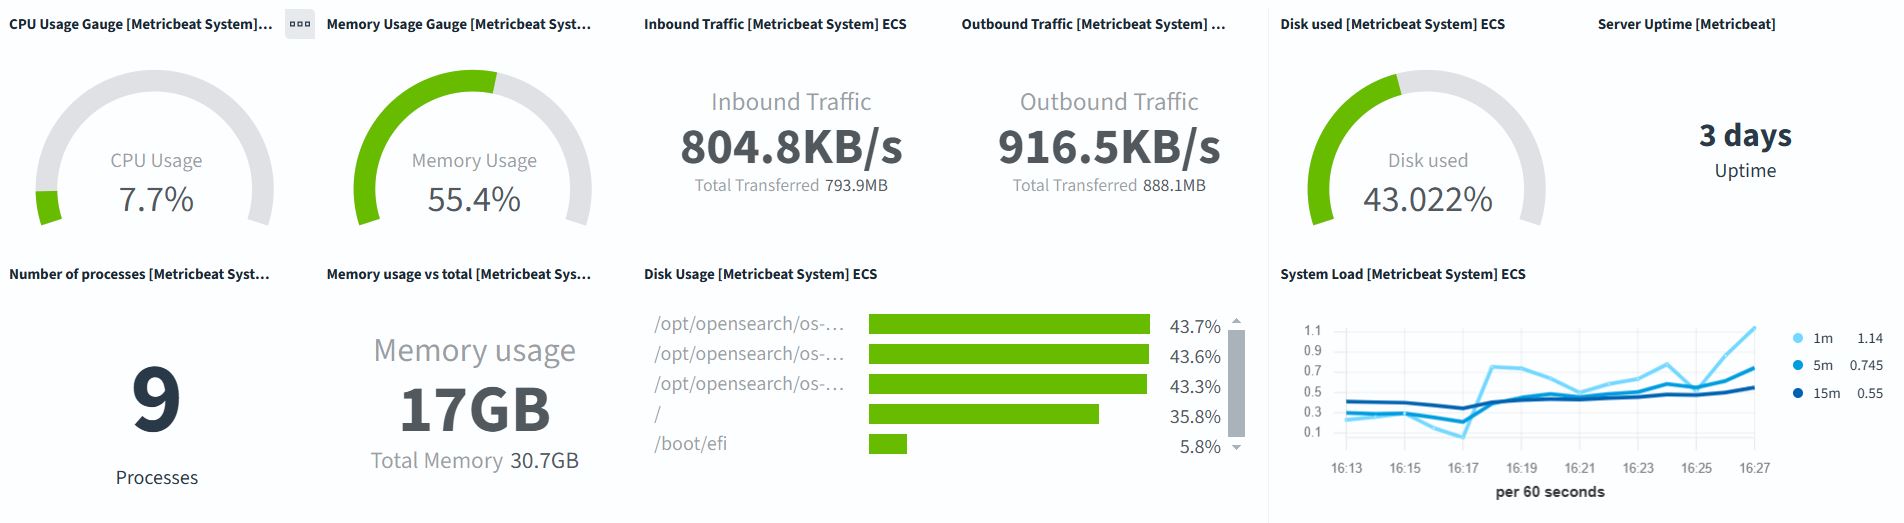
We have a cluster of machines to track the behavior of every server that we are managing. This cluster consists in several BI platforms which allow to track and monitor different variables :
- Most important metrics of every server like memory and cpu consumption, cache memory utilized, disk size, etc. We can monitor every transaction geographically, showing in a map to show where the requests are coming from and analyze bottlenecks.
- Analyze API calls performance, analyzing time of response, errors percentages, and mapping the API calls to SQL database queries (useful to understand bottlenecks in the database)
- Analyze system logs (like the database, dhis, tomcat, etc.), in order to understand user behaviors, control access, memory leaks, database behavior, etc.
In addition to that, and for DHIS2 servers, we also provide a solution to monitor in close to real time:
- DHIS2 active users over time
- DHIS2 android users syncing with the servers, and the android app being used
- List of non authorized users and the resources they are trying to access.
- List of DHIS2 users and conflicts, normally due to poor configuration, so it will be possible to check and solve what the issues are checking this report
We also provide a centralized alerting system, which is configured to send alerts to different channels (Teams, slack, Skype, emails, SMS, etc.) whenever there is a condition that triggers an alert. For example: Analytics are not running, DHIS2 is taking a long time to respond, cpu or memory reaching 80% utilization, etc.
DHIS2 Hosting
We normally provide cloud management with AWS services or Azure, but we are open to exploring other options with you if desired. All DHIS2 servers will have the following setup:
- Based on Unix
- DHIS2 installed
- Nginx reverse proxy installed
- Apache Tomcat servlet container installed
- Database (PostgreSQL) installed
- Daily backup
- Monitoring system
- Server Resources Scaling
- Alerting
- Configure SSL certificate
All our servers meet all prescribed security protocols, including multiple levels of protection to ensure the confidentiality of the data.
Server security
- Access with SSH2 protocol that provides much more security compared to SSH1, which is disabled.
- Allow access only through port 22. For web access will be opened 80 and 443, having a redirection from port 80 to port 443 for secure web access
- Updates of operating system and security packages.
- Monitoring and auditing of system logs
Database Security
- Establish and follow an adequate policy for the passwords of the database, with strong, protected passwords and periodic change
- Blocking of ports and external access to the database.
- SSL connection between application and database.
- Policy of daily backups. Secure sending of data, encrypted on the server, and never publicly accessible.
Webserver security
- Connection always with HTTPS, redirecting HTTP traffic to HTTPS.
- Disable non-secure SSL protocols. Only TLS encryption will be allowed.
- Follow webserver security recommendations and updates.
Chatbots for disease surveillance (reporting)
Context
The use of smartphones and social media apps like Facebook Messenger, WhatsApp, Viber or Telegram was widespread among our target users (the health worker) to connect with friends and family.
Overcoming the impediments of traditional paperbased and custom-built mobile reporting tools, there is an approach for real-time disease notification mechanism using social media chatbots.
These tools were found to be ideal due to their ease of use (everybody has a social media account!) and require only minimal training, maintenance, and troubleshooting (no need to upgrade apps, manage user accounts, or ensure compatibility with mobile devices).
Solution
In order to facilitate the adoption of mobile case reporting solutions among the users, we designed and deployed several chatbots for different domains like health and education, using technologies like Microsoft Bot Framework or RapidPro.
Our chatbots are implemented on top of several social media tools and messaging applications, like: Facebook messenger, Viber, Whatsapp, Skype, Slack, Zalo, Telegram, among others.
These solutions enable the collection of case-based data from the bot and push them to any backend (i.e. to a tracker program in a DHIS2 instance). In addition, chatbot flows are being built out to facilitate communication and provide support to the end users.
Our chatbots are being used in Vietnam, Laos, Myanmar (covid and malaria cases), Philippines, Panama, and Indonesia (education).
Use Case – NODIS Chatbot in PSI Myanmar
In Myanmar, Population Services International launched the Notifiable Diseases Information System (“NODIS”) chatbot, that was intially built for reporting Malaria cases using Facebook Messnger and saved into a DHIS2 database.
The chatbot was updated with additional options for disease notification for tuberculosis (“probable TB”) and fever with rash (covering measles, dengue, chikungunya, etc.), as well as including an additional reporting channel, Viber.
Also, instant alerts to local health authorities are sent via automated SMS and reports are synced with open-source DHIS2 platform, which opens the door for potential future integration of data into national surveillance systems.
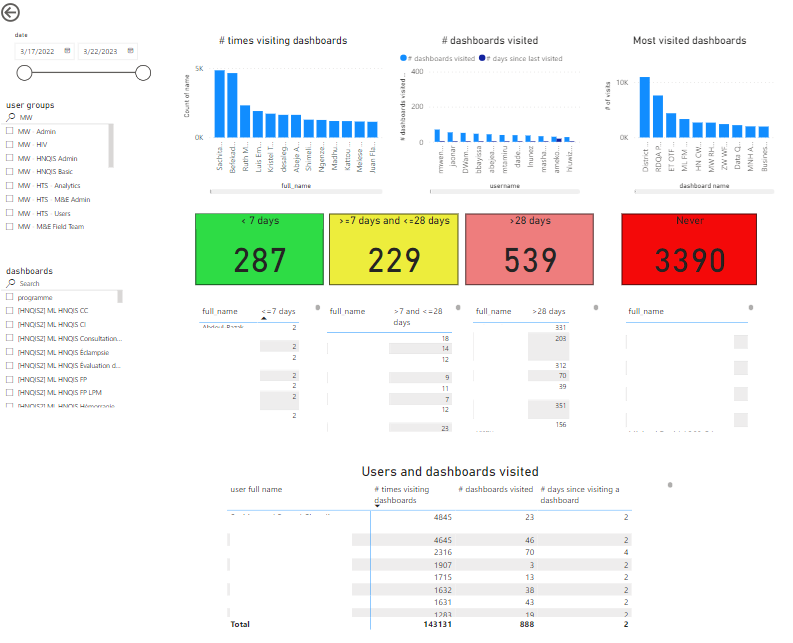
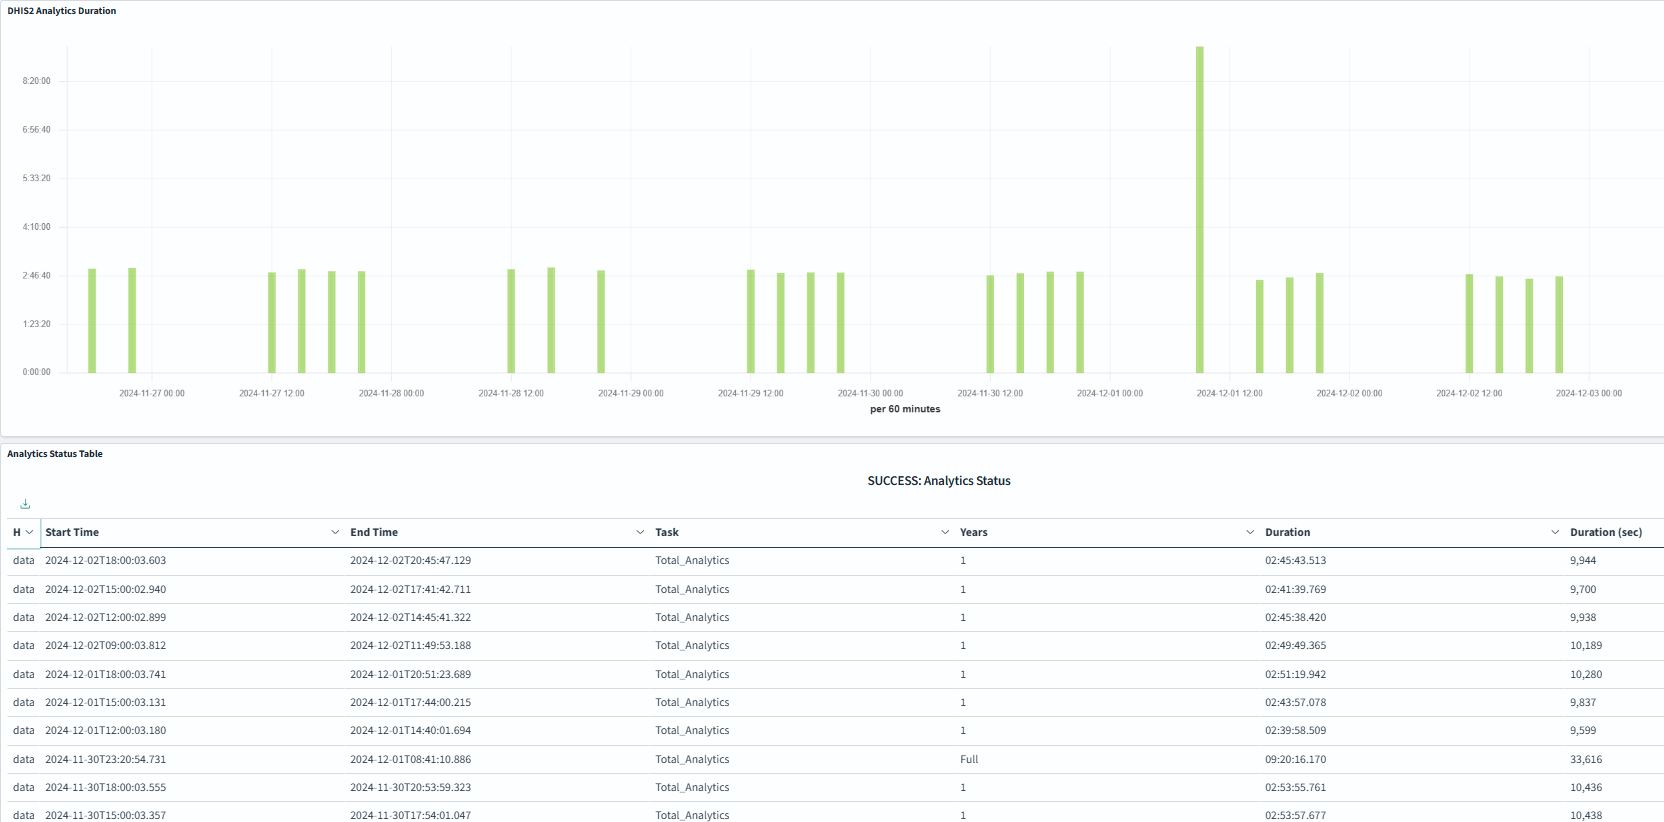
DHIS2 usage analytics: A data warehouse approach to understanding data use
You can see the whole presentation given in the DHIS2 Annual Conference 2024 within the Novel and Cutting Edge Analytics Use-Cases session.
Context
How are the end users navigating dhis2? What are the main dhis2 visualizations accessed? Are the dashboards really being used? All these are key questions in order to measure how the system is being used, and if the system is having an impact in terms of data quality, access and meaningful visualization.
DHIS2 has tools (eg. Usage Analytics app) that allow rendering visualizations for metrics such as favorite views, top favorites, etc. However, depending on the complexity of the metrics to render, the default DHIS2 apps are not currently as adequate at measuring dynamic analyses of different types of user behaviors and engagement.
Most of this information can be exposed in the system logs as free text, especially in the web server and application logs. It is possible to find in the navigation of those files information about the most common API endpoints used, latency time, devices and browsers accessing the system, and, if exposed, user names.
Approach
For complex usage analytics this is an approach that uses the DHIS2 system logs as a source for analyzing end user behavior and engagement with the system. Regardless of the size of the log files and their format, it is possible to transform the content of those files in dimensions and facts that can be stored in a data warehouse. It is then possible to connect the data warehouse with any BI tool (like PowerBI, Tableau, superset, etc.) to perform complex calculations, generate custom metrics, and render advanced visualizations of DHIS2 system use.
This solution is deployed for some clients, like Population Services International (PSI) or MSF Spain.